
Resident satisfaction in senior living is often discussed as a score to be raised or protected, but the reality is more nuanced because satisfaction is not linear. It rises, falls, and then stabilizes as residents move through their time in a community. Decisions about design, staffing, and operations are often made without fully accounting for where residents are in that lifecycle. When satisfaction dips, the instinct may be to start by fixing programs or messaging. However, a stronger starting point is to understand when and why those fluctuations occur and which factors can realistically be influenced at each stage.
What You Will Learn
How the Research was Conducted
The research paired direct resident feedback with the Holleran National Benchmark, which compiled three years of surveys across all levels of care, including nearly 121,000 independent living resident surveys. In addition to overall satisfaction, the benchmark examined four engagement domains: voice, connection, fulfillment, and well-being.
To add ground-level context, J. D. Landis, Project Manager and Sr. Associate (NCIDQ, IIDA, ASID, IES) at SFCS and Chris Fares Walley, President of Holleran, interviewed 100 independent and assisted living residents at four communities across the country. Residents were asked how long they had lived in the community, how happy they were on a 1–10 scale, whether they would recommend the community, and what they would change about the physical environment or programming. Additional questions explored why they moved, why they selected their community, and whether they felt they were getting the most from community life.
The benchmark findings show why it is important to look beyond a single overall satisfaction score and consider engagement, which Holleran breaks down into four domains:
Together, these measures provide more context for understanding why residents may remain broadly satisfied even when specific elements of engagement change.
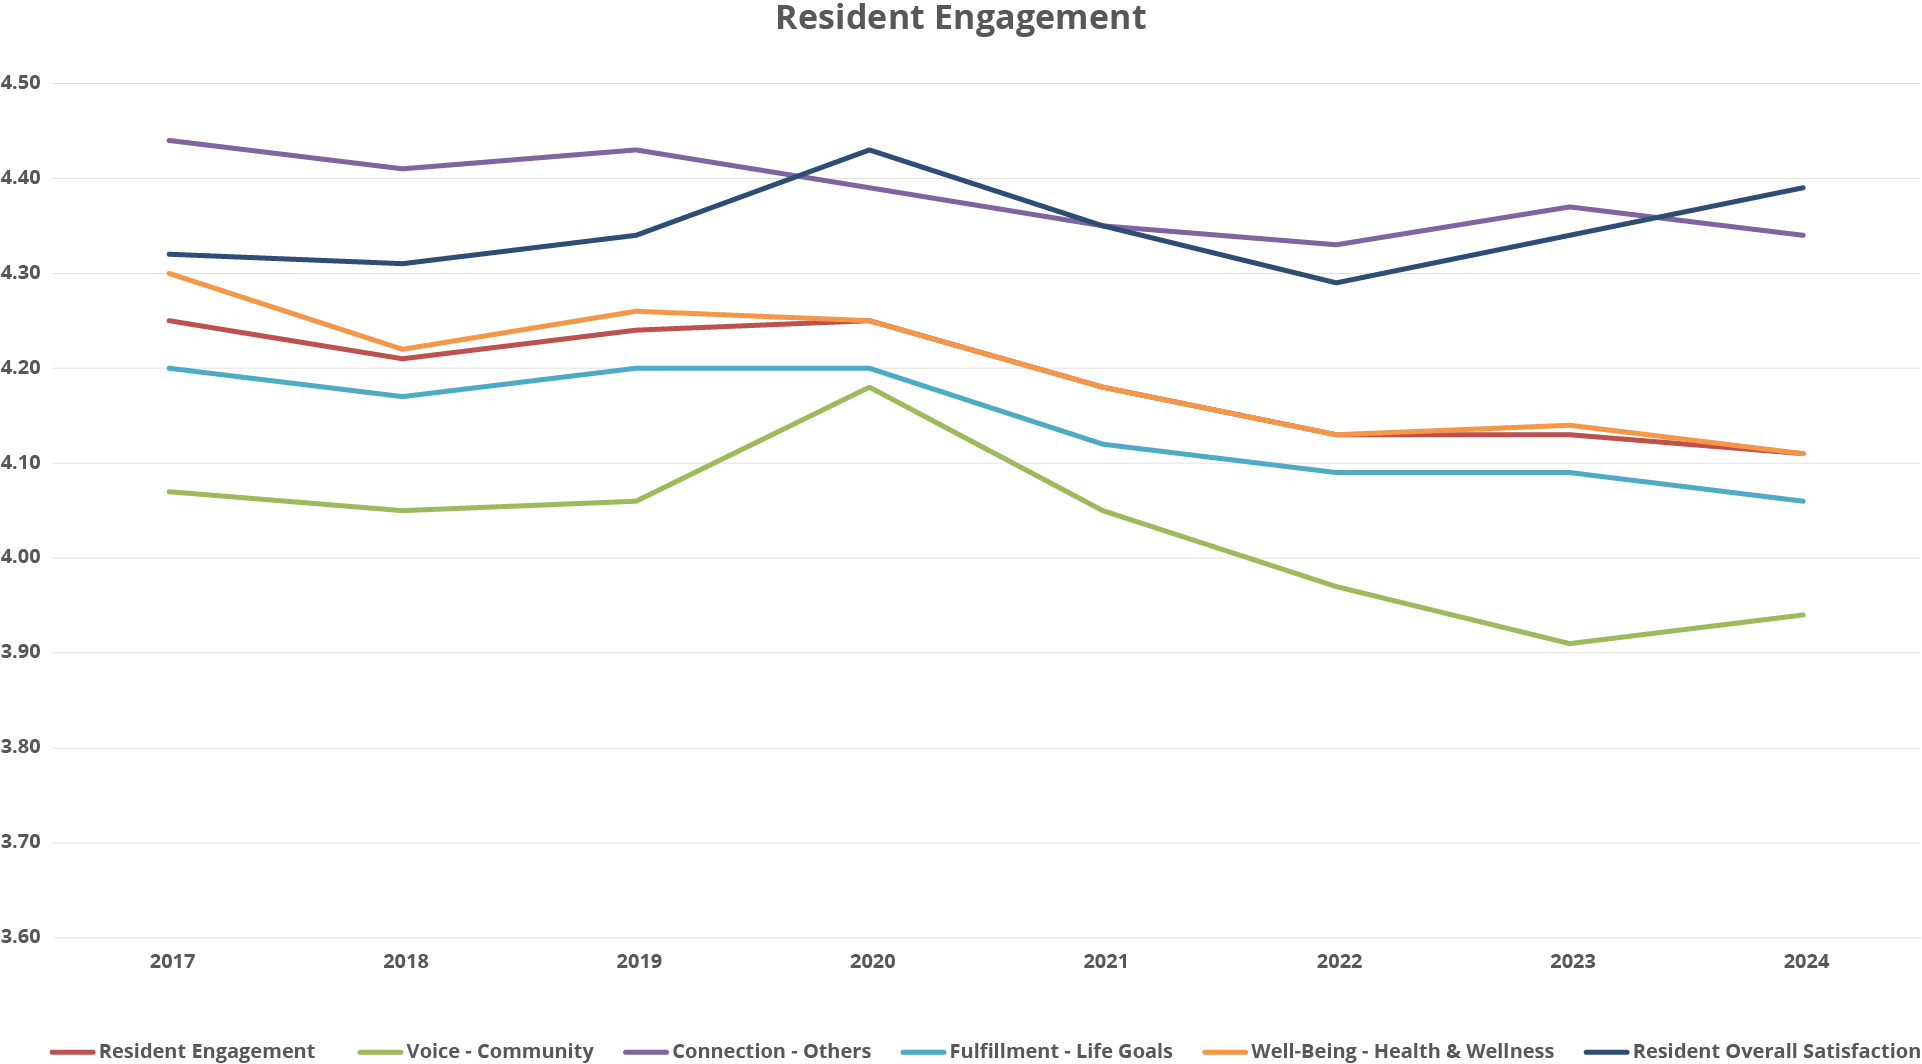
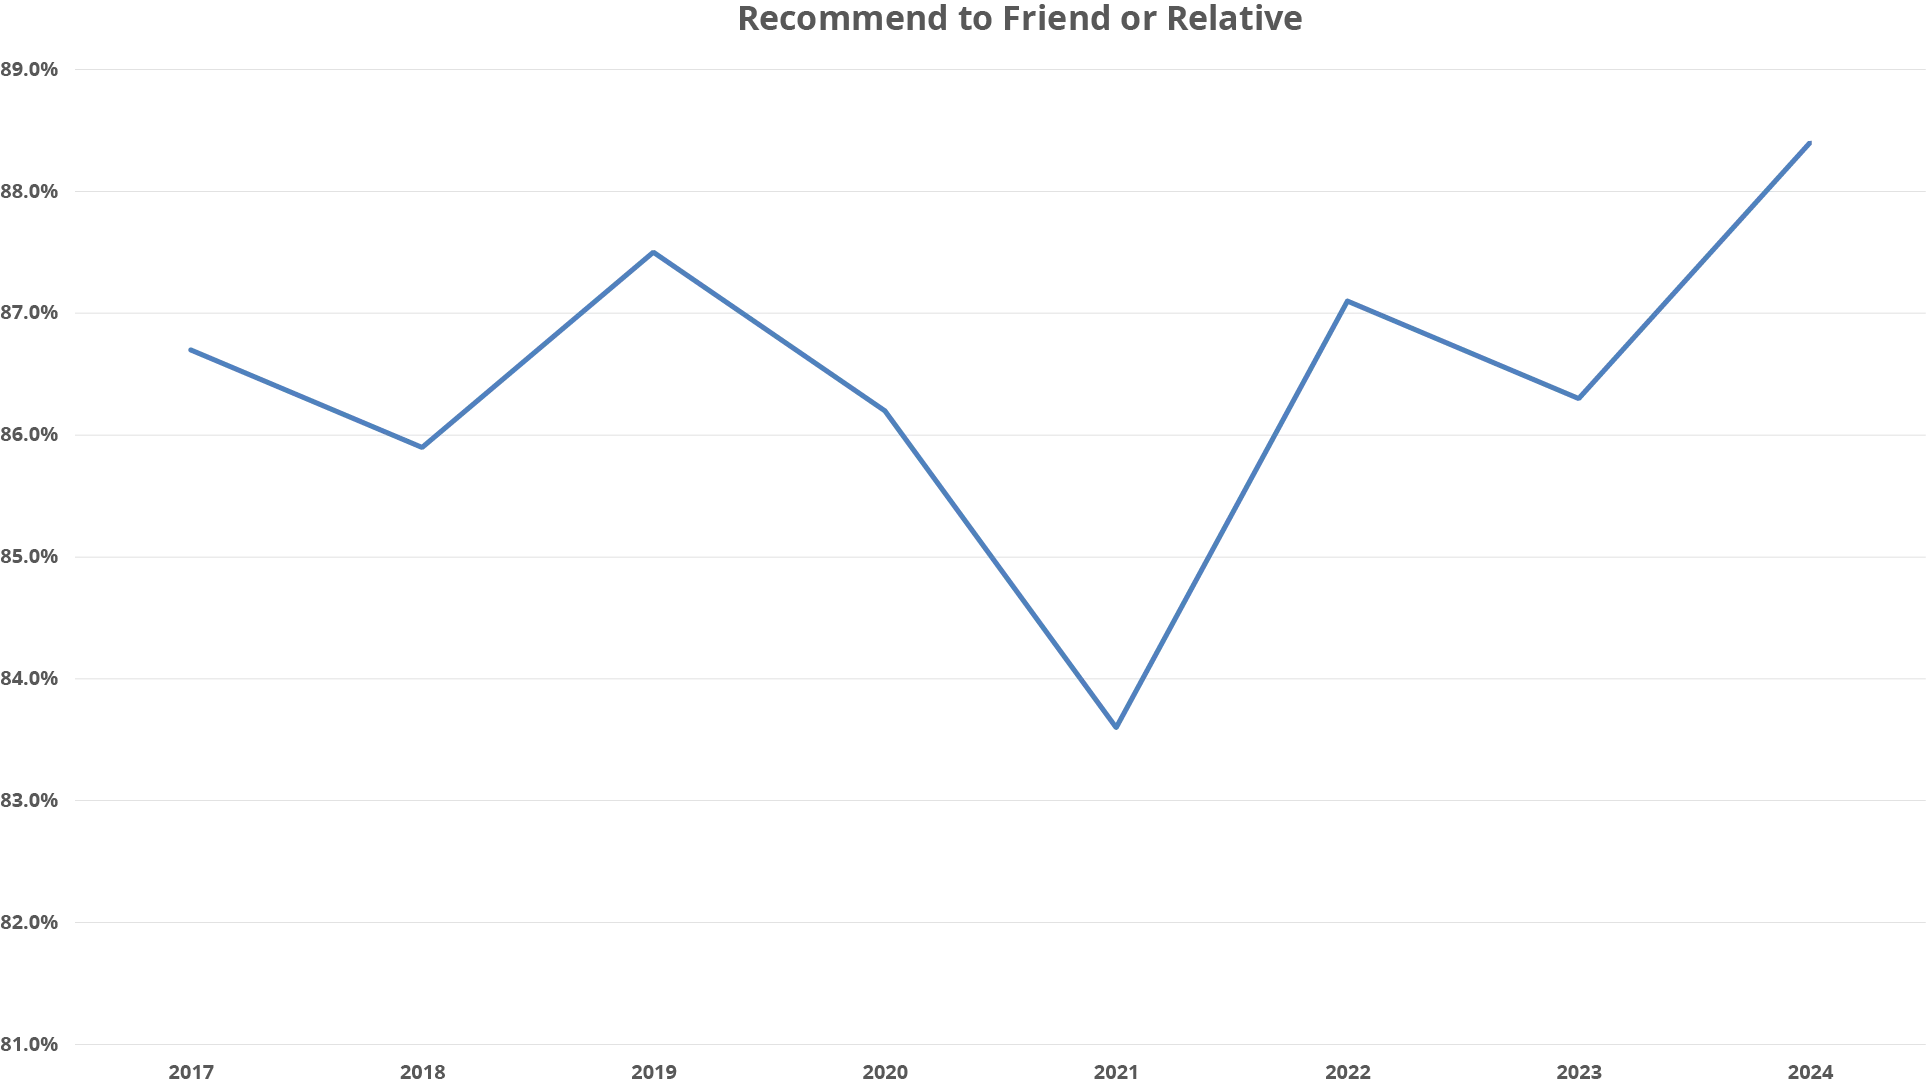
According to their data, the longitudinal benchmark showed a sharp decline in engagement after 2020, followed by an uneven recovery. Voice improved in the most recent year discussed, while connection, fulfillment, and well-being remained areas to watch. At the same time, overall satisfaction increased after 2022, and approximately 83% to 86% of residents said they would recommend their community to a friend or family member. The contrast reinforces the need to interpret satisfaction and engagement together rather than treating either as a complete measure of resident experience.
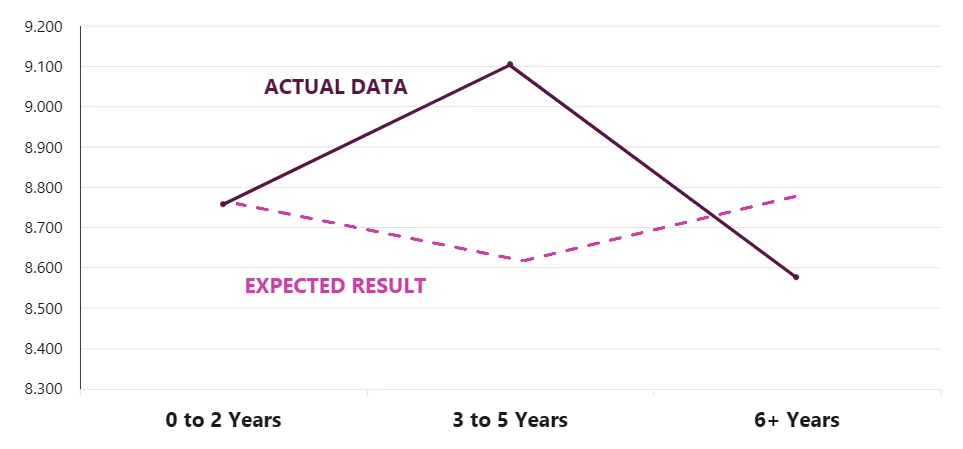
The expected lifecycle pattern begins with high satisfaction during the honeymoon phase, dips as residents move into everyday routines, and rises again as they establish long-term stability. The resident interview data did not follow that expected curve exactly: the normalization group reported the highest average happiness. That divergence is the point of using the lifecycle as a diagnostic tool rather than treating it as a fixed satisfaction curve.
Resident Micro Satisfaction Survey
A lower score does not automatically mean a community is failing, just as a high score does not mean there is nothing to improve. Viewed by lifecycle stage, the data helps leaders ask a more useful question: what do residents need at this point in their community experience, and what might the score be revealing about those needs?
Benchmarking data and resident interviews can be viewed through a three-phase community lifecycle:
Onsite interviews reinforced this finding. When residents were asked how long they had lived in their community, how happy they were on a 1–10 scale, and whether they would recommend the community to others, average happiness scores followed a similar arc:
The early years of residency are characterized by high satisfaction and optimism. Residents are making new friends, exploring amenities, and often comparing their current experience favorably to the challenges of maintaining a former home.
Benchmark data shows strong overall satisfaction during this phase, supported by high “recommend to a friend or family member” scores, which is often in the mid‑80% range. At this stage, expectations are largely shaped by the decision to move in, rather than by long-term operational realities.
The normalization phase is where assumptions are most likely to be tested. Residents have settled in, routines are established, and novelty has worn off. Expectations shift from discovery to consistency.
Interestingly, interview data showed the highest average happiness scores during this phase. This contradicts the common assumption that satisfaction inevitably dips after the honeymoon period. One explanation is that residents have found their social footing and feel more confident navigating daily life.
At the same time, this is when residents begin to articulate what could be better. Decisions made during this phase can either reinforce long-term stability or introduce dissatisfaction that becomes harder to correct later.
For residents who have lived in a community six years or longer, satisfaction stabilizes at a slightly lower, but still strong, level. At this stage, residents have established core relationships, selected the activities that matter most to them, and adjusted their expectations accordingly.
Satisfaction at this stage is no longer driven by novelty or onboarding, but by reliability. Consistency of staff, clarity of communication, and environments that continue to support independence become increasingly important.
Although the lifecycle unfolds over the years, the foundation for later satisfaction is often established early on. The first months after moving in shape residents’ familiarity with the environment, their initial relationships, and their confidence in daily routines, which are experiences that can influence how they move into the normalization and stability phases.
Across all phases, one period stands out as especially influential: the first three to six months after move‑in.
Chris Fares Walley explains:
“Research shows that in about three to six months, most residents have kind of settled in. And that basically just means they know where the dining room is. They know where the activity room is. They can get back to their apartment without getting lost.”
Adjustment, in this context, is highly practical. It is about orientation, wayfinding, and confidence navigating daily routines. Benchmark data supports this, with new resident orientation scoring an average of 3.85 out of 5, indicating room for improvement.
Residents consistently described the value of:
The lifecycle explains when satisfaction can fluctuate and resident comments help explain what people encounter during those phases. Asking residents what they would change connects broad satisfaction measures to the physical and operational details experienced every day.
When they were asked what they would change about their community, responses clustered into four categories:
Notably, about 25% of residents said they would change nothing, signaling that many communities are meeting expectations. Where dissatisfaction did appear, the environment was often at the center.
Kitchens emerged as the most frequently cited design challenge because it can become a daily measure of independence. A cabinet, shelf, or appliance that is difficult to reach may be a small inconvenience at move-in, but it can become a recurring safety and accessibility issue as residents’ needs change over time.
Within the context of their own community, one resident stated:
“The way the kitchen is designed is not friendly for older people. The microwave is so high that many people I know don’t use it at all.”
There are kitchen accessories available, such as pull-down shelves, that can be incorporated into the design, but depending on what is added, they can increase the kitchen cost by roughly 30% to 40%. However, including these accessories supports aging in place, can reduce risk, and aligns the physical space with long-term resident needs. That upfront cost becomes a comparison between a higher or lower initial capital cost and the long-term flexibility of a residence designed to remain usable as reach and mobility change.
Residents evaluate the community through repeated experiences, not isolated amenities. Dining settings, wellness spaces, and staff interactions can support the familiarity, and reliability residents seek.
Dining feedback further reinforced the link between environment and experience. Residents spoke not only about food quality, but about how dining rooms felt: Large, open spaces often felt transactional, while smaller “pockets” supported comfort and choice.
Health and wellness feedback echoed similar themes, including requests for accessible fitness equipment, pool access, and outdoor walking paths.
Tying these experiences together was staff, who residents consistently cited as the most important factor in happiness. Benchmark analysis revealed a correlation between employee engagement and resident satisfaction, including examples where:
This relationship was identified by conducting resident and employee engagement studies during the same period at one community and comparing department-level employee results with related resident satisfaction measures. Dining services was the least engaged department, while dining-related measures were the community’s lowest resident scores. Administration was the most engaged area, while staff friendliness, positive attitude, respect for privacy, kindness, and caring were among the ten highest resident satisfaction results.
“Obtaining insight from your residents as they're moving through the community, from their orientation, even as a resident association president… getting that feedback is not always easy,” says Landis.
Resident satisfaction in senior living is not a single number to be managed, nor is it a static measure of whether a community is succeeding. It reflects how residents experience belonging, independence, confidence, and support over time. The community lifecycle gives leaders a clearer way to interpret those experiences by showing that satisfaction shifts as residents move from first impressions to everyday routines and long-term stability.
This perspective is important because the same score can mean different things depending on when it appears. A lower score among newer residents may point to orientation, wayfinding, or social integration challenges. A strong score among mid-tenure residents may reflect successful acclimation and deeper connection, while a slight decline among long-term residents may reveal opportunities to sustain relevance, independence, and reliability as needs evolve.
Ground-level data is most valuable when it challenges assumptions. Resident interviews, benchmark results, and employee engagement data together help leaders see where the physical environment, staffing model, programming, and operations are reinforcing or interrupting the resident experience. Kitchen accessibility, dining room scale, wellness access, and ease of navigation are not separate from satisfaction; they become part of the daily rhythm residents use to judge whether a community continues to support them.
For leaders, the opportunity is not simply to respond when satisfaction changes, but to anticipate what residents need at each phase of community life. When lifecycle data is used alongside resident and employee feedback, it becomes more than a measurement tool. It becomes a planning tool for creating communities that remain responsive, supportive, and meaningful long after move-in.
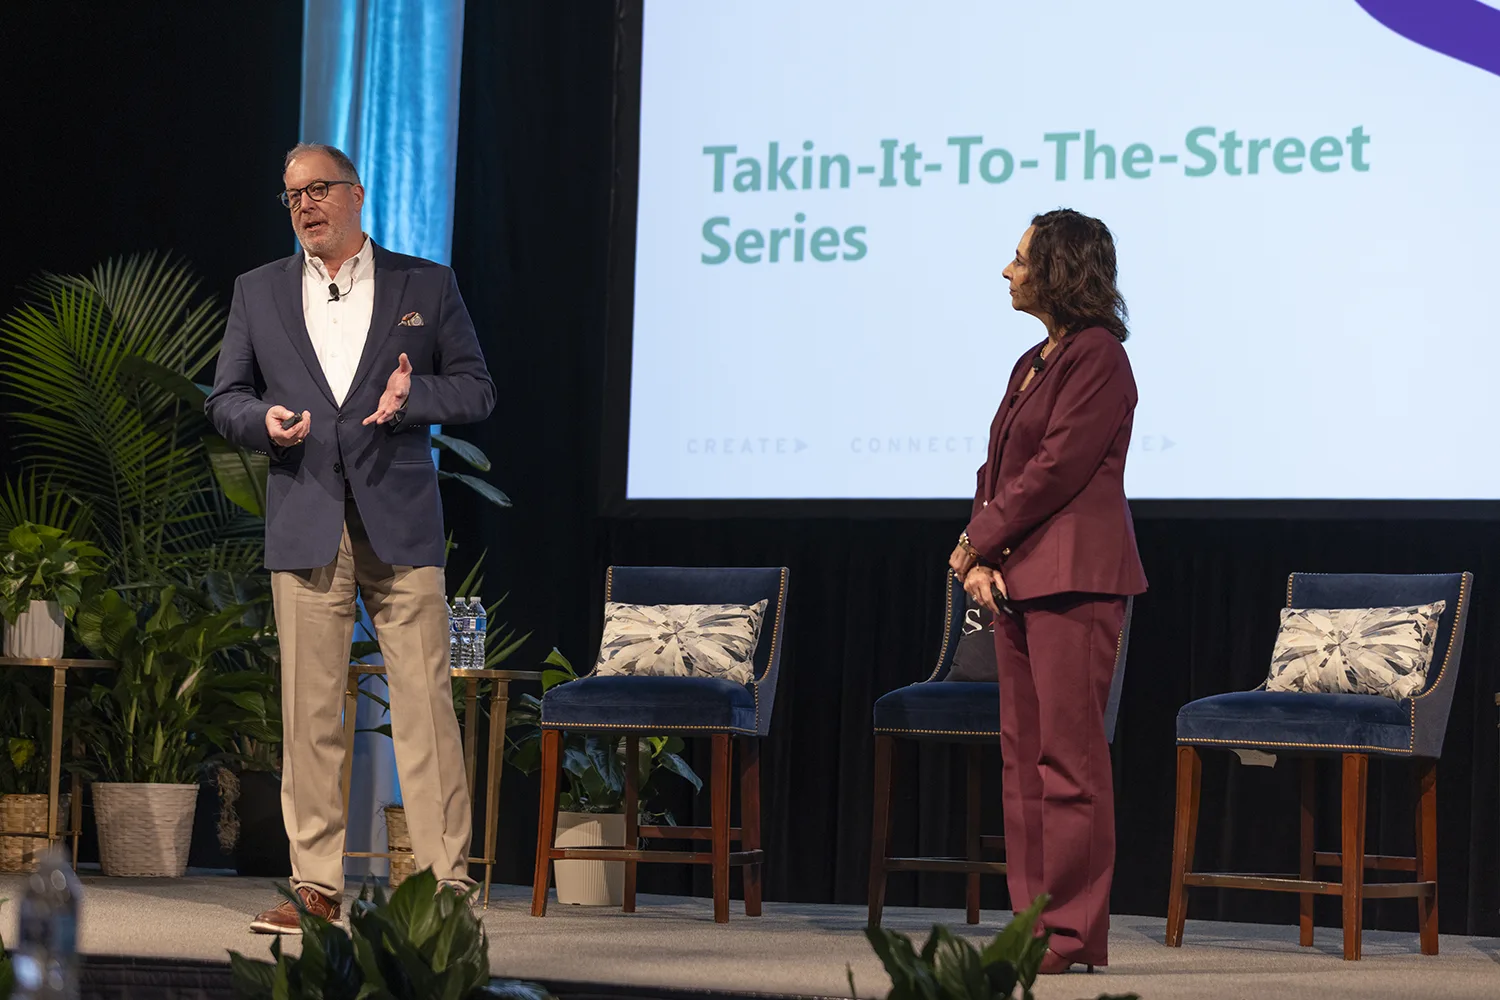
This article is a summary of the content presented during the session “Takin-It-To-The-Street -- First Impressions to Future Visions: Understanding the Community Life Cycle” presented by J. D. Landis and Chris Fares Walley at SFCS’s 41st By Design: Create. Connect. Inspire. on February 5th, 2026.
If this year’s conversations around creativity, connection, and future-focused design resonated with you, we hope you’ll consider joining us on February 2 - 4, 2027 at the Hotel Roanoke in Roanoke, VA. Click here to let us know you are interested!

Our team is committed to providing quality service, meaningful connections, and thoughtful design. We believe the balance of these key elements has the power to encourage relationships and create exceptional environments where people – and projects – can flourish.
We improve our services and advertising by using Microsoft Clarity. Learn more by reading our Privacy Policy and Disclaimer.


